
Feature videos
Short walkthroughs of what QuantLogIQ can do, from reading a Point & Figure chart to setting up watchlist alerts.
 0:57
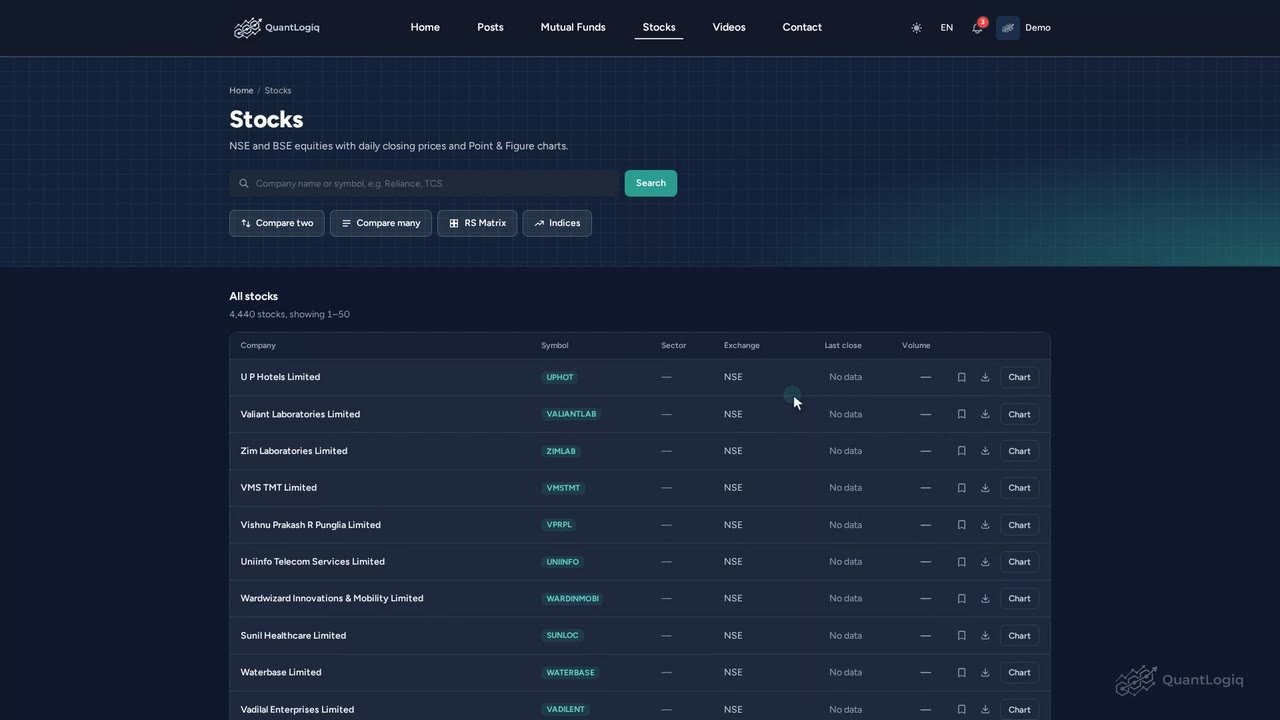
Find any stock on QuantLogIQ
In this video, let's see how to find any listed stock on QuantLogIQ, and what you can do from the results. Steps: 1. On the Stocks page, st...
 1:02
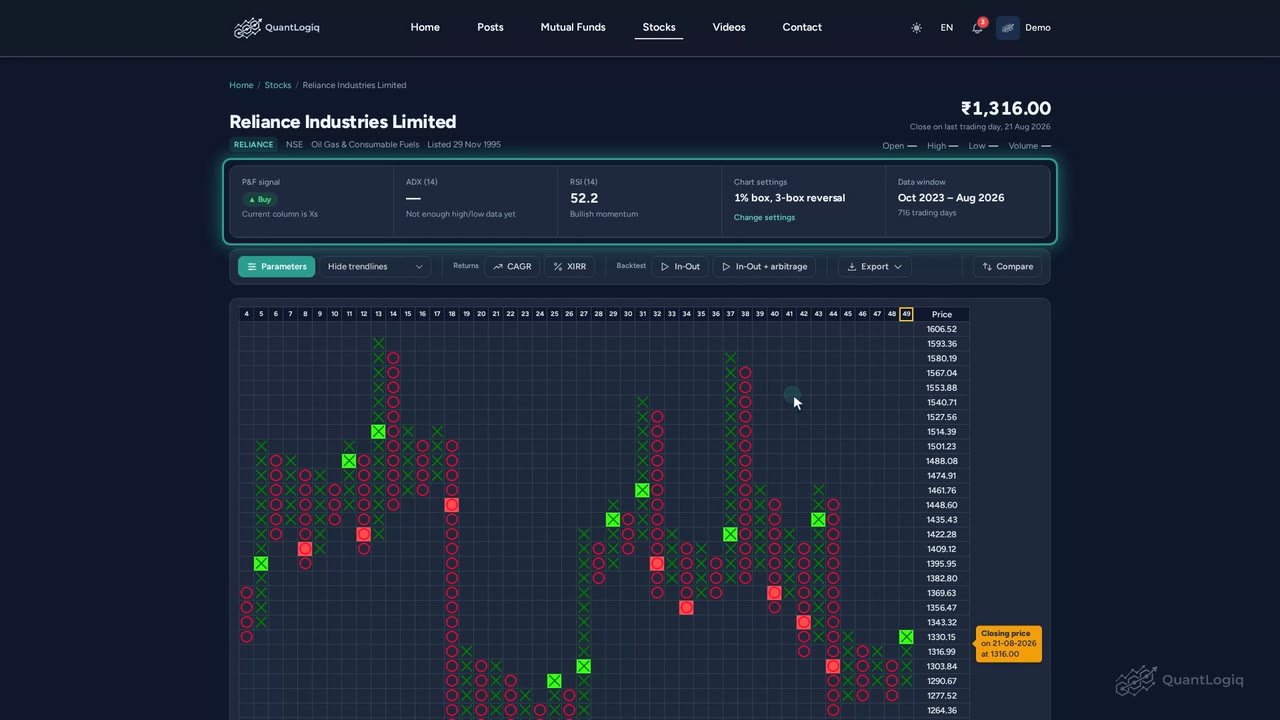
How to read a Point & Figure chart
Let's learn how to read a Point and Figure chart on QuantLogIQ. We'll use Reliance as our example. Steps: 1. At the top, the P&F signal sho...
 0:52
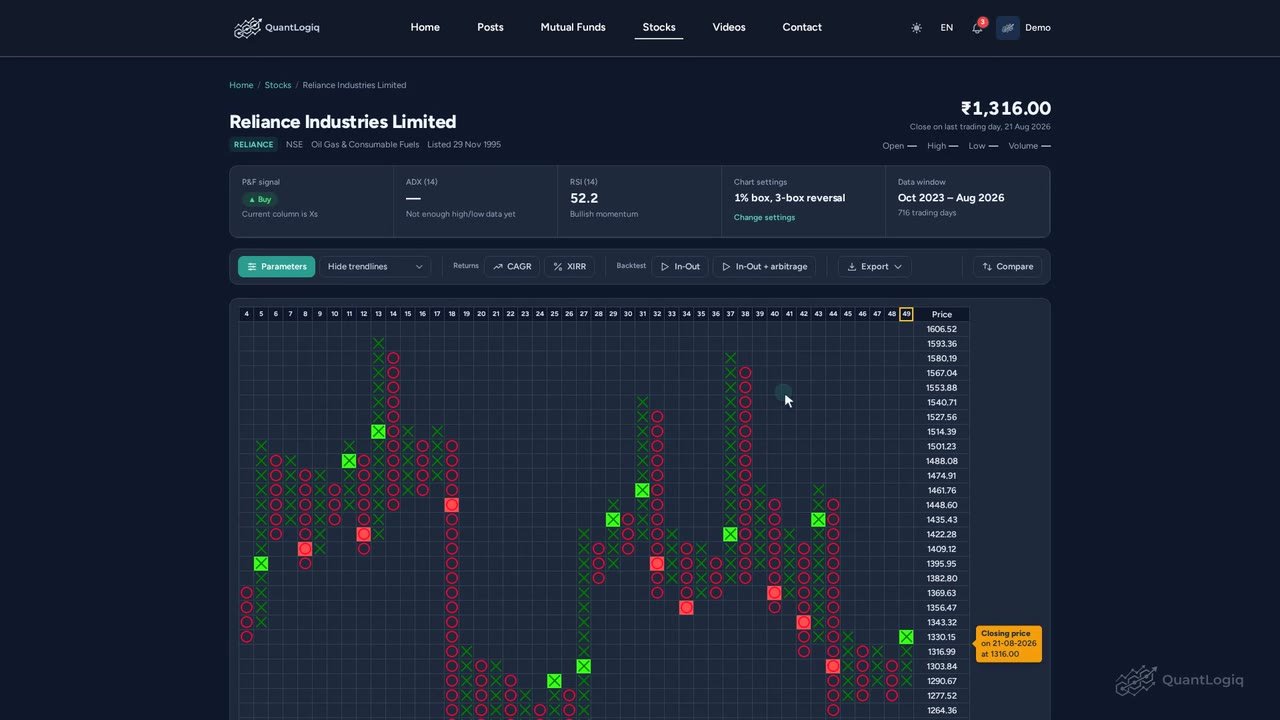
Change the box size, reversal and dates of a chart
Every Point and Figure chart has a few settings, and QuantLogIQ lets you change them. Let's see how. Steps: 1. Click Parameters. 2. Box siz...
 0:52
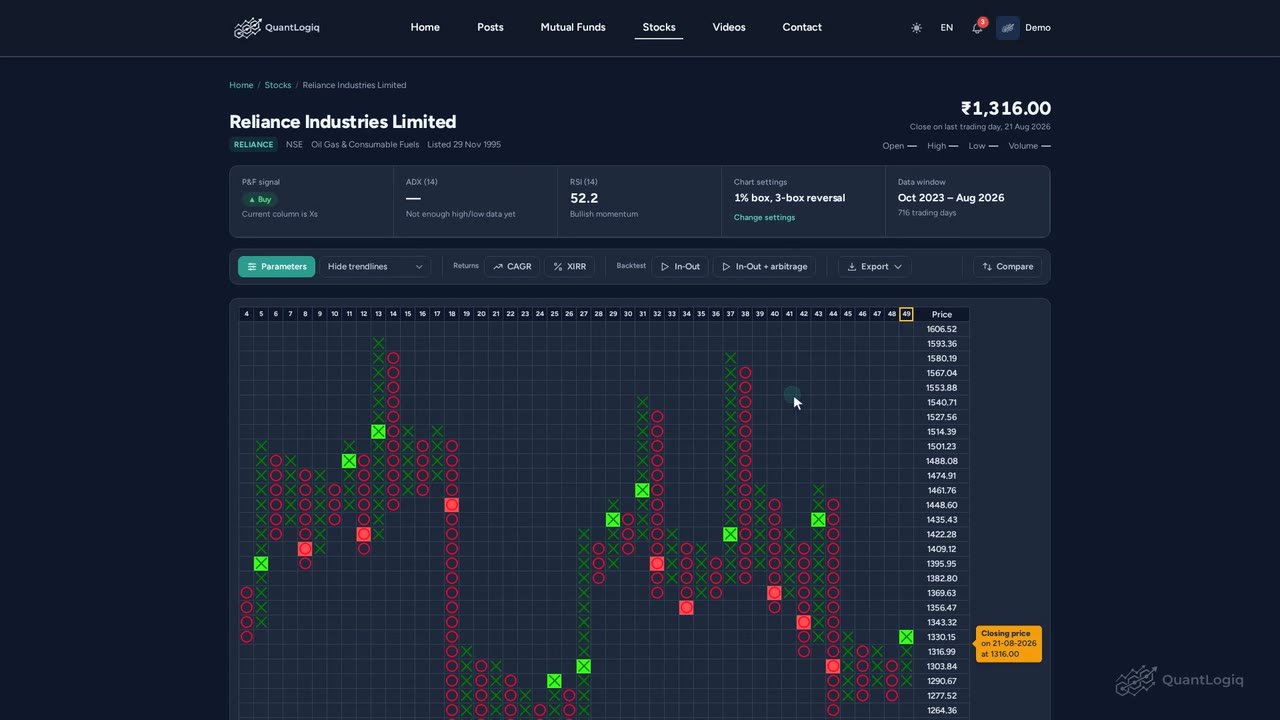
Trendlines and price targets on a P&F chart
QuantLogIQ can draw trendlines and price targets on any Point and Figure chart. Let's switch them on. Steps: 1. Use this dropdown, which sa...
 0:43
Price history and exporting a chart
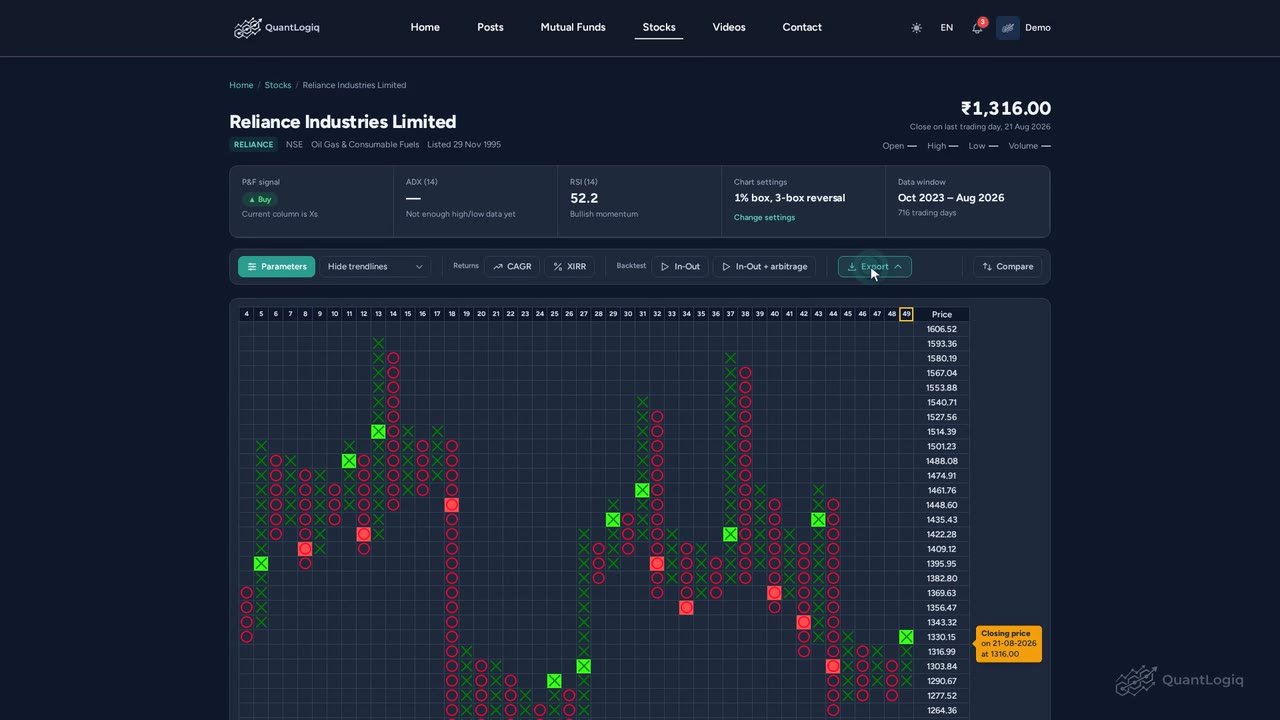
Let's see how to check the recent prices of a stock, and how to save its chart. Steps: 1. Click Export, at the right of the toolbar. 2. Pri...
 1:00
Compare two stocks with a ratio chart
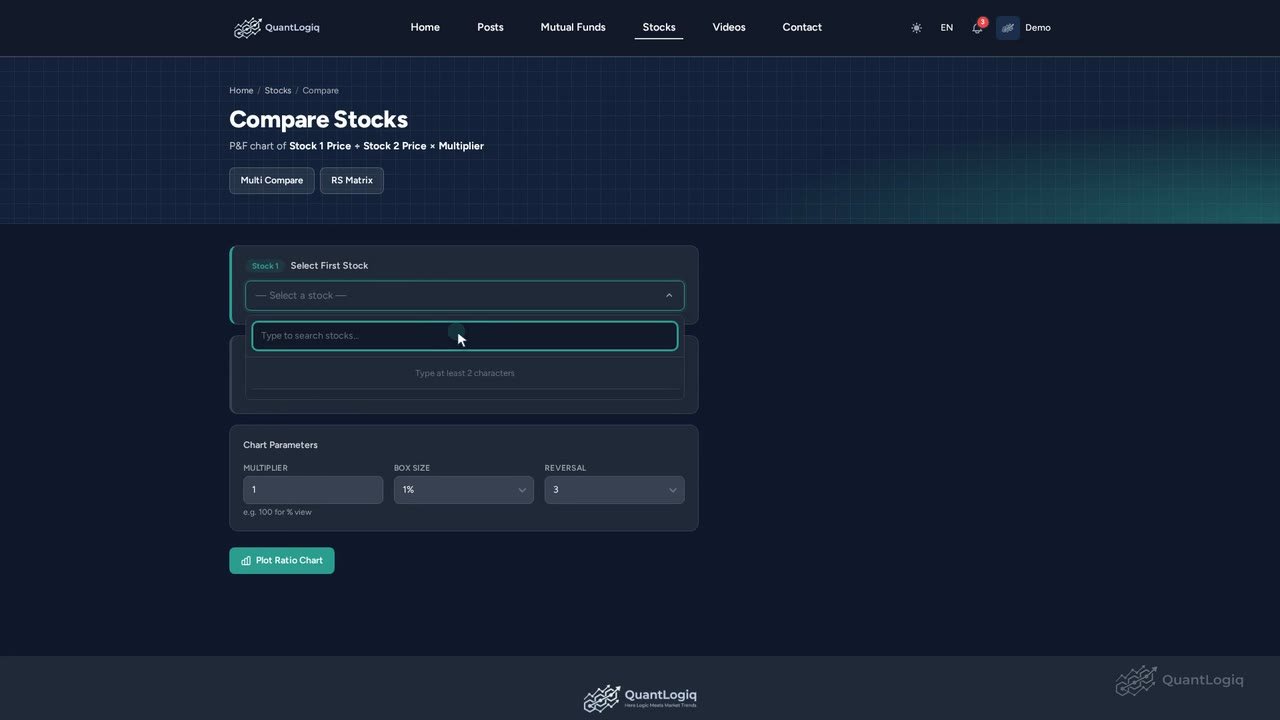
Which of two stocks is doing better? The compare tool answers that with a single chart. Let's try Reliance against TCS. Steps: 1. Pick the...
 0:58
Compare many stocks and find the strongest
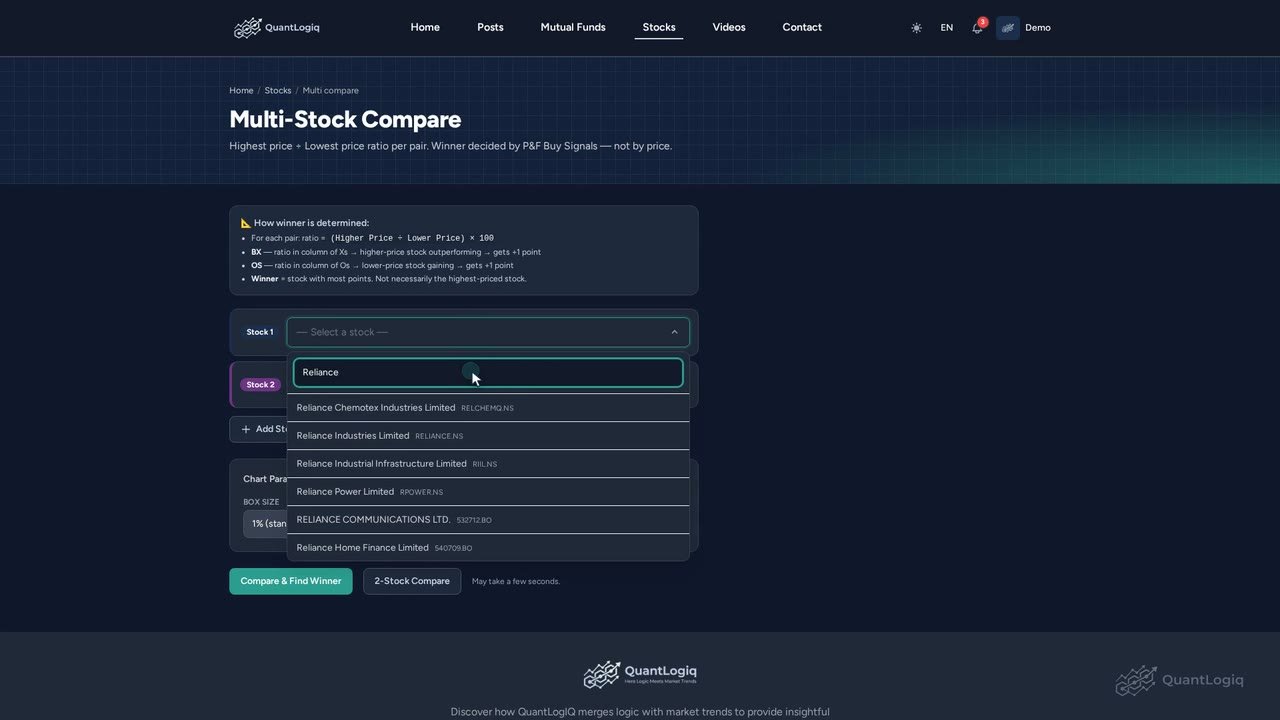
Want to compare more than two stocks at once? Multi-compare tests every pair, and tells you which one is strongest. Steps: 1. Pick the stoc...
 0:59
Build a Relative Strength Matrix for stocks
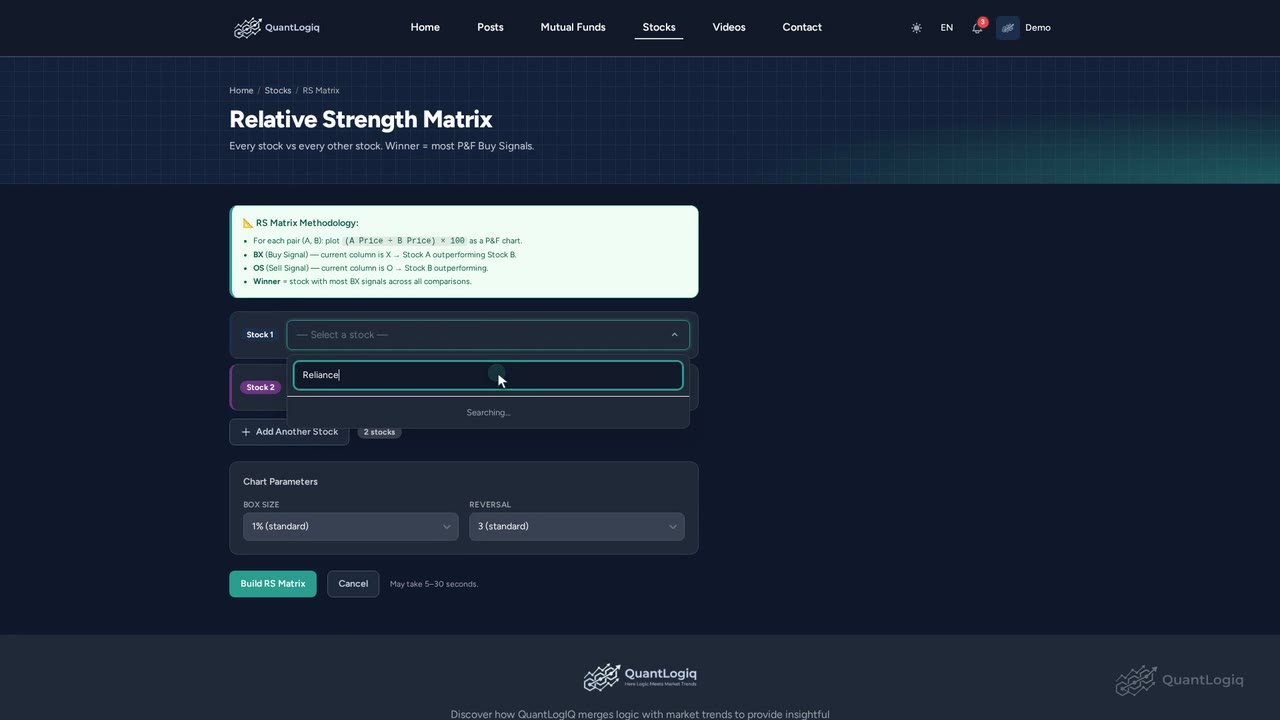
The RS Matrix, or relative strength matrix, ranks a group of stocks by how strong each one is against all the others. Steps: 1. Pick the st...