
Feature videos
Short walkthroughs of what QuantLogIQ can do, from reading a Point & Figure chart to setting up watchlist alerts.
 0:56
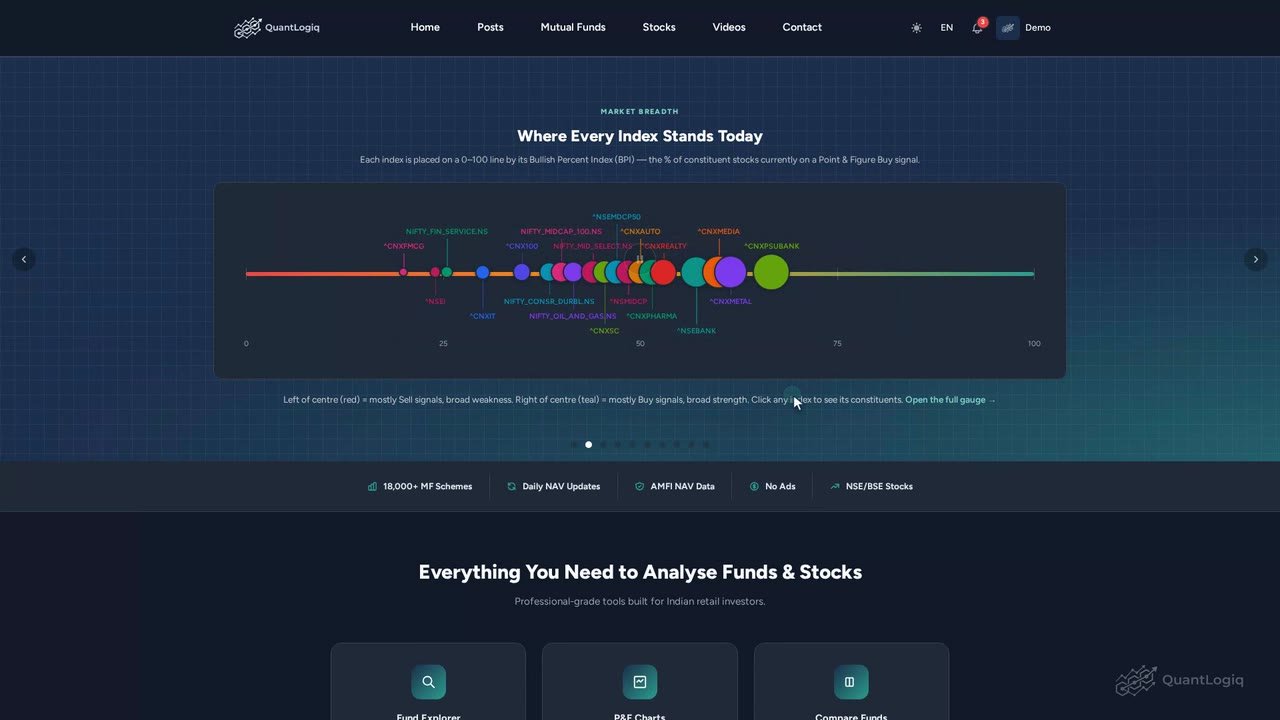
A quick tour of the QuantLogIQ home page
Welcome to QuantLogIQ. In this short tour, let's see what's on the home page, and where each feature lives. Steps: 1. Right at the top, thi...
 0:59
Create your QuantLogIQ account
Creating a QuantLogIQ account takes about a minute. Let's do it together. Steps: 1. Start with your name and email address. 2. Your mobile...
 0:41
How to log in to QuantLogIQ
Let's see how to log in to QuantLogIQ, and what to do if you forget your password. Steps: 1. Type the email address you signed up with. 2....
 1:23
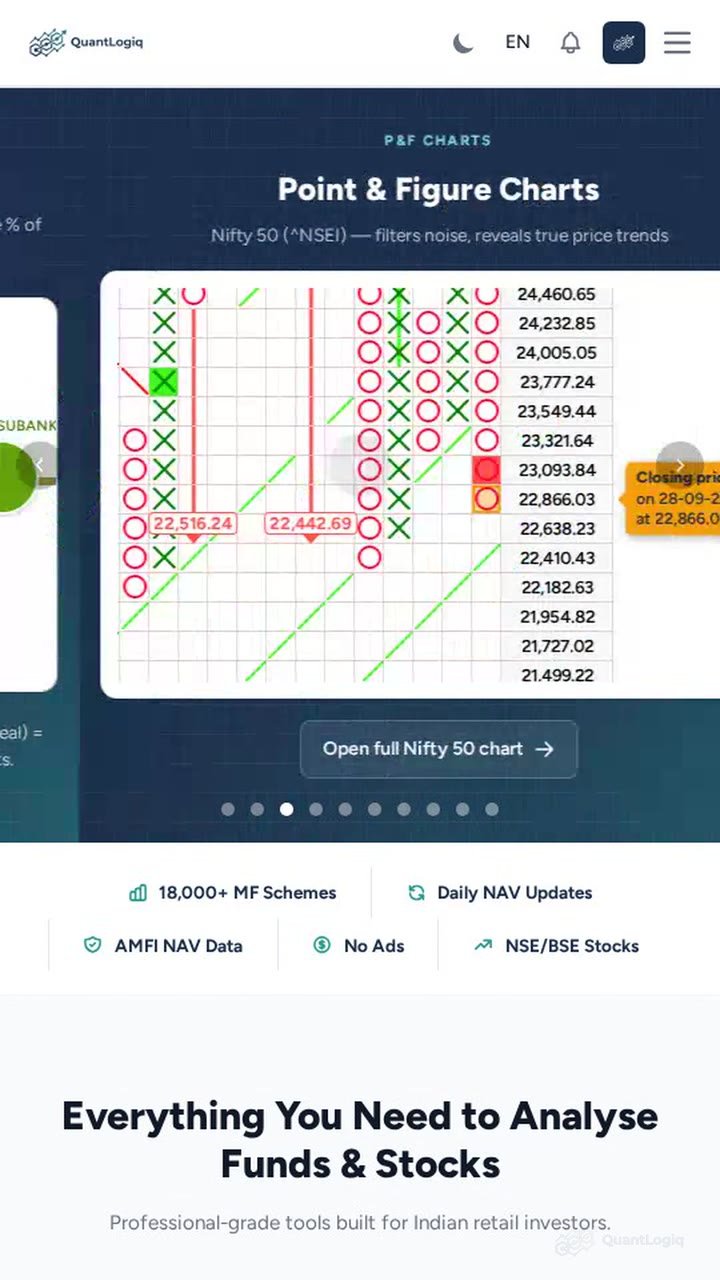
How to install QuantLogIQ on Android and turn on notifications
Install the QuantLogIQ app on your Android phone and turn on notifications, so alerts for your watchlist reach you even when the app is clos...
 1:20
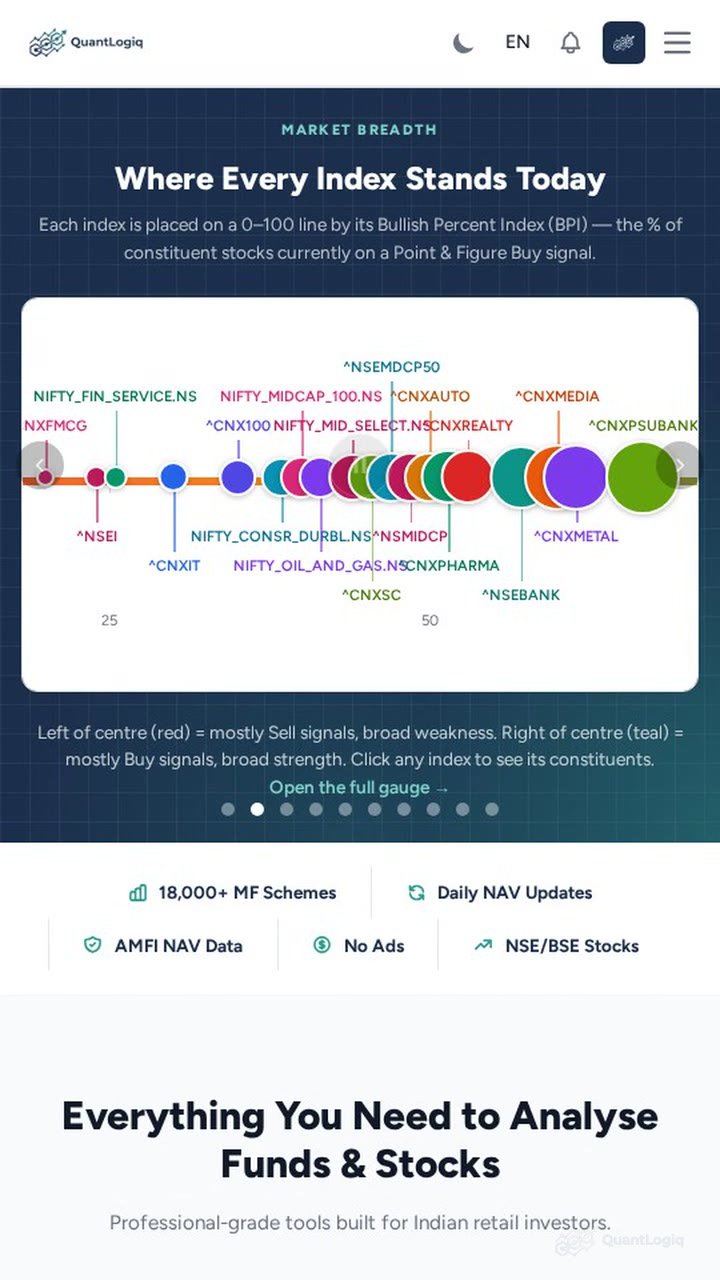
How to add QuantLogIQ to your iPhone and turn on notifications
Add QuantLogIQ to your iPhone Home Screen and turn on notifications for your watchlist. Add to Home Screen: 1. Open quantlogiq.in in Safari...
 1:10
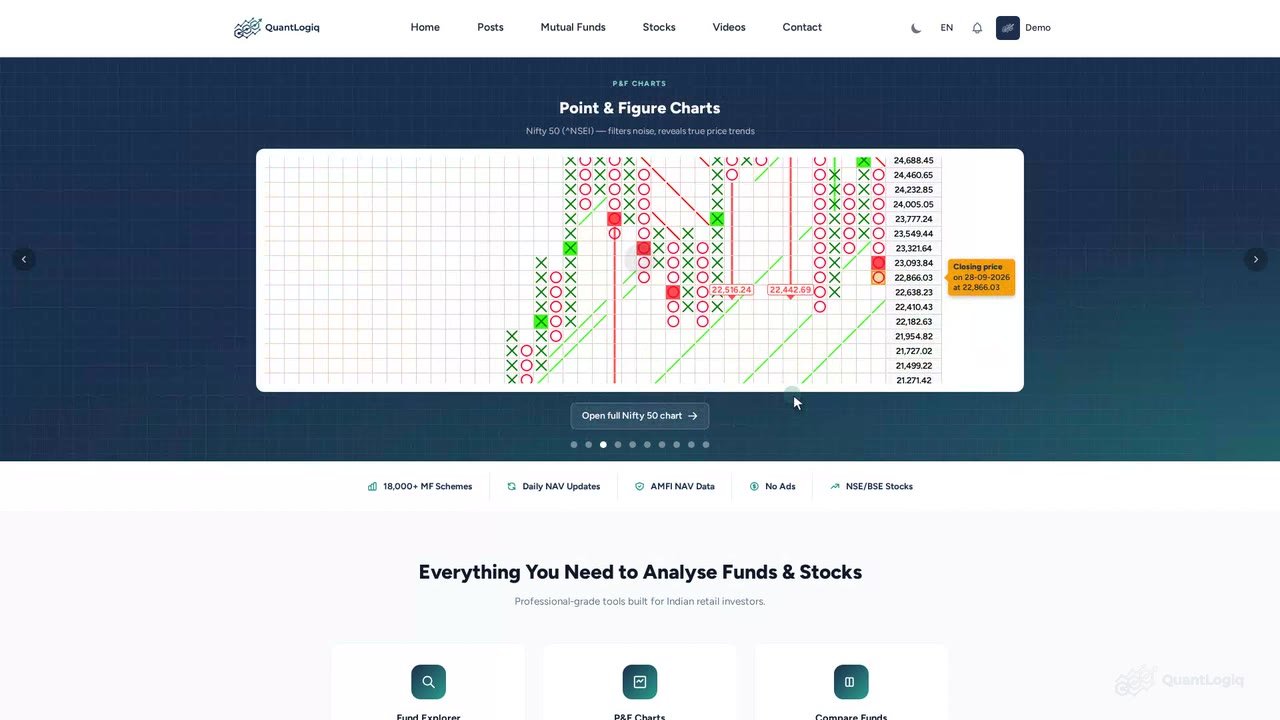
How to install QuantLogIQ on Windows and turn on notifications
Install QuantLogIQ as a desktop app on Windows and turn on desktop notifications for your watchlist. Install the app: 1. Open quantlogiq.in...
 0:57
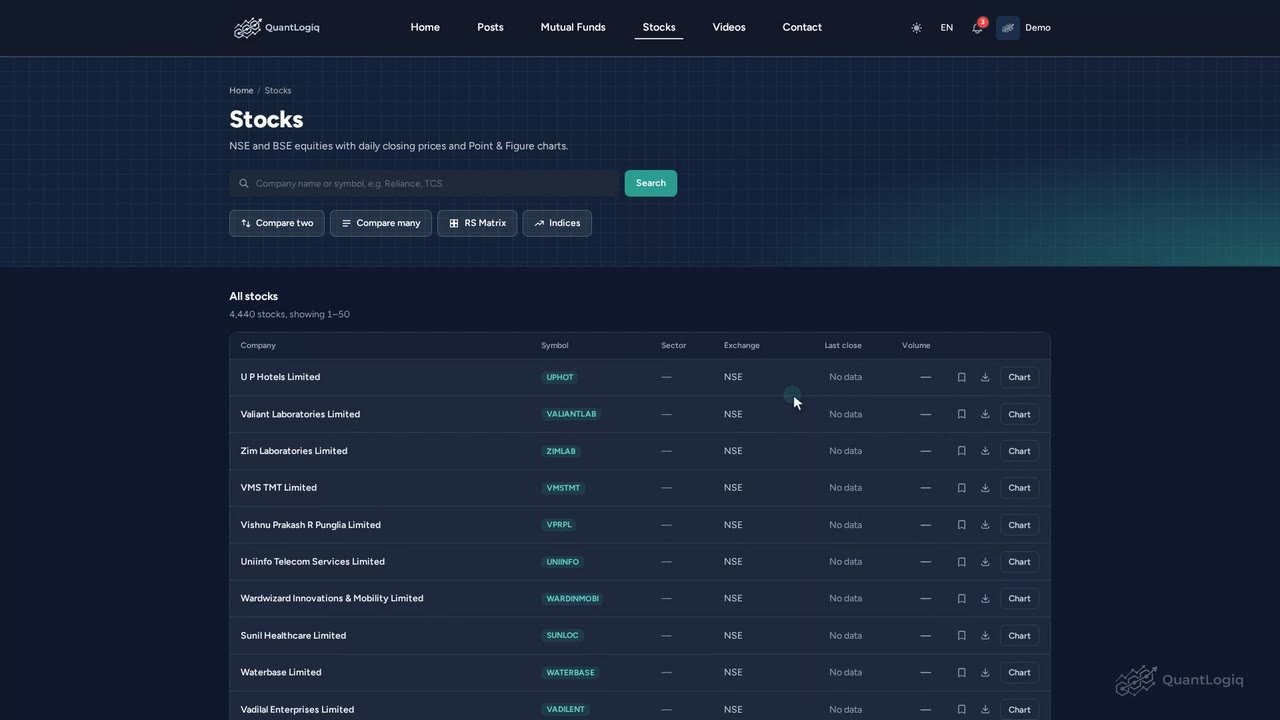
Find any stock on QuantLogIQ
In this video, let's see how to find any listed stock on QuantLogIQ, and what you can do from the results. Steps: 1. On the Stocks page, st...
 1:02
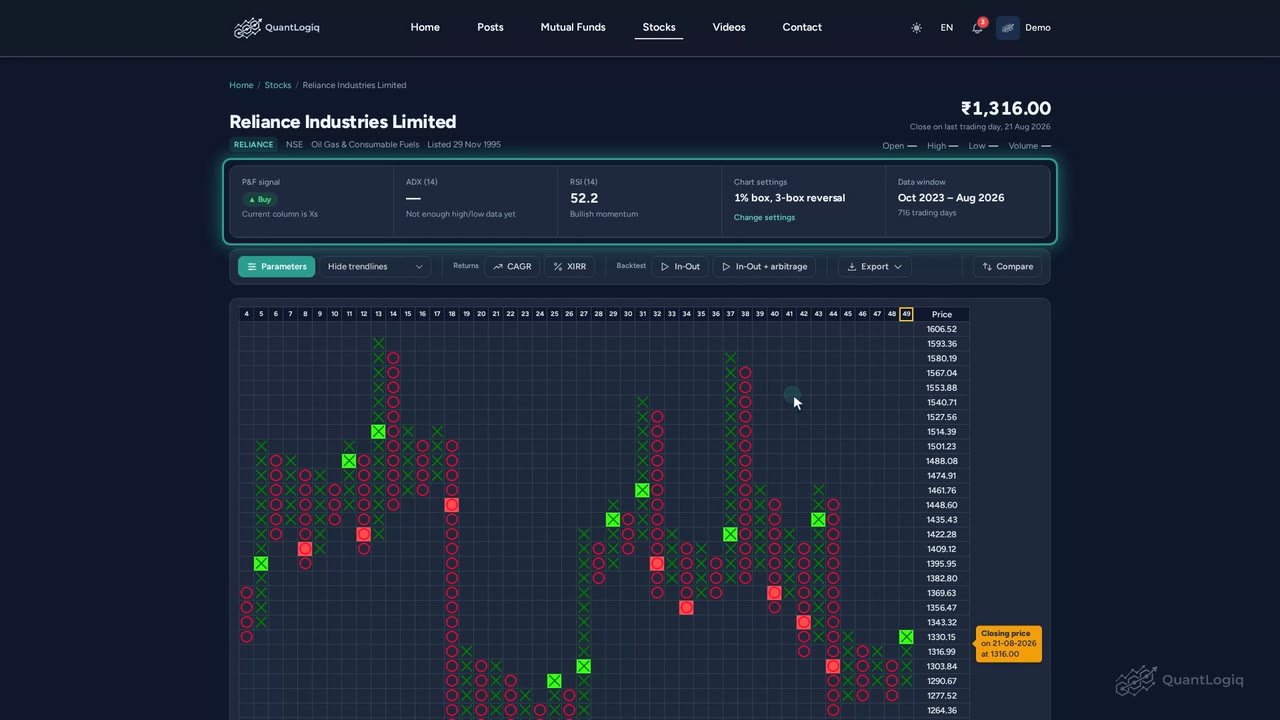
How to read a Point & Figure chart
Let's learn how to read a Point and Figure chart on QuantLogIQ. We'll use Reliance as our example. Steps: 1. At the top, the P&F signal sho...
 0:52
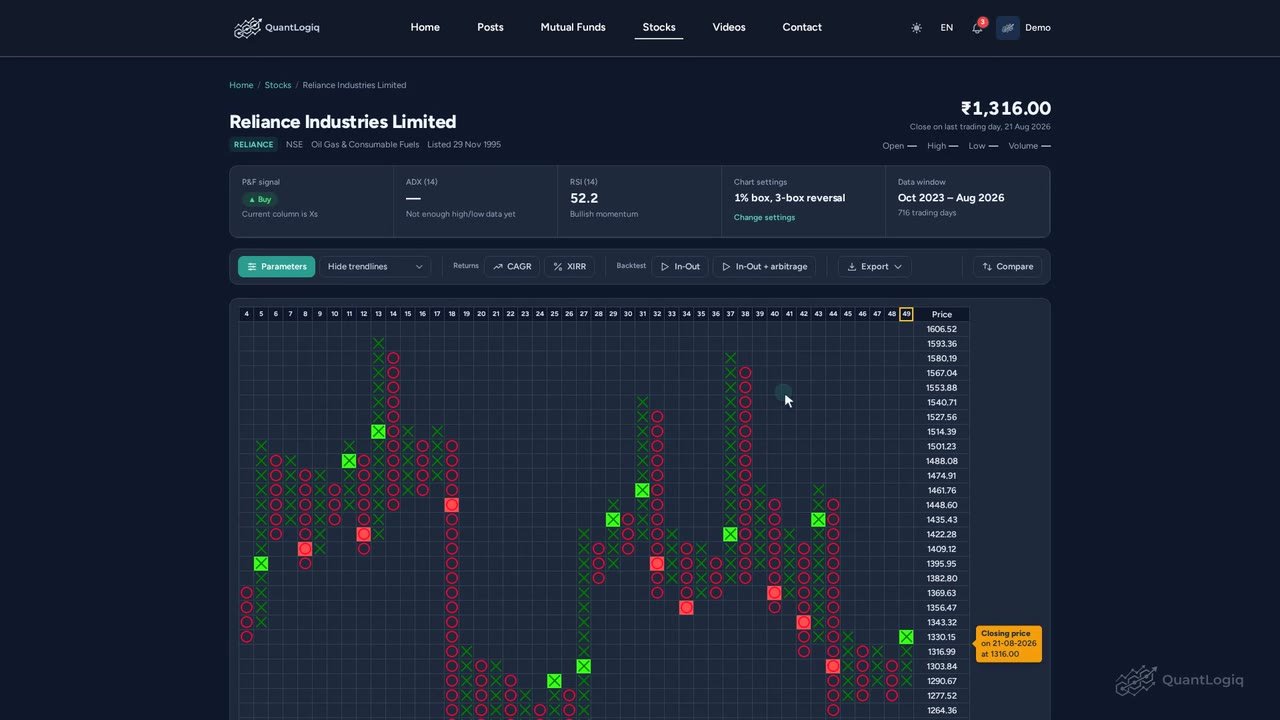
Change the box size, reversal and dates of a chart
Every Point and Figure chart has a few settings, and QuantLogIQ lets you change them. Let's see how. Steps: 1. Click Parameters. 2. Box siz...
 0:52
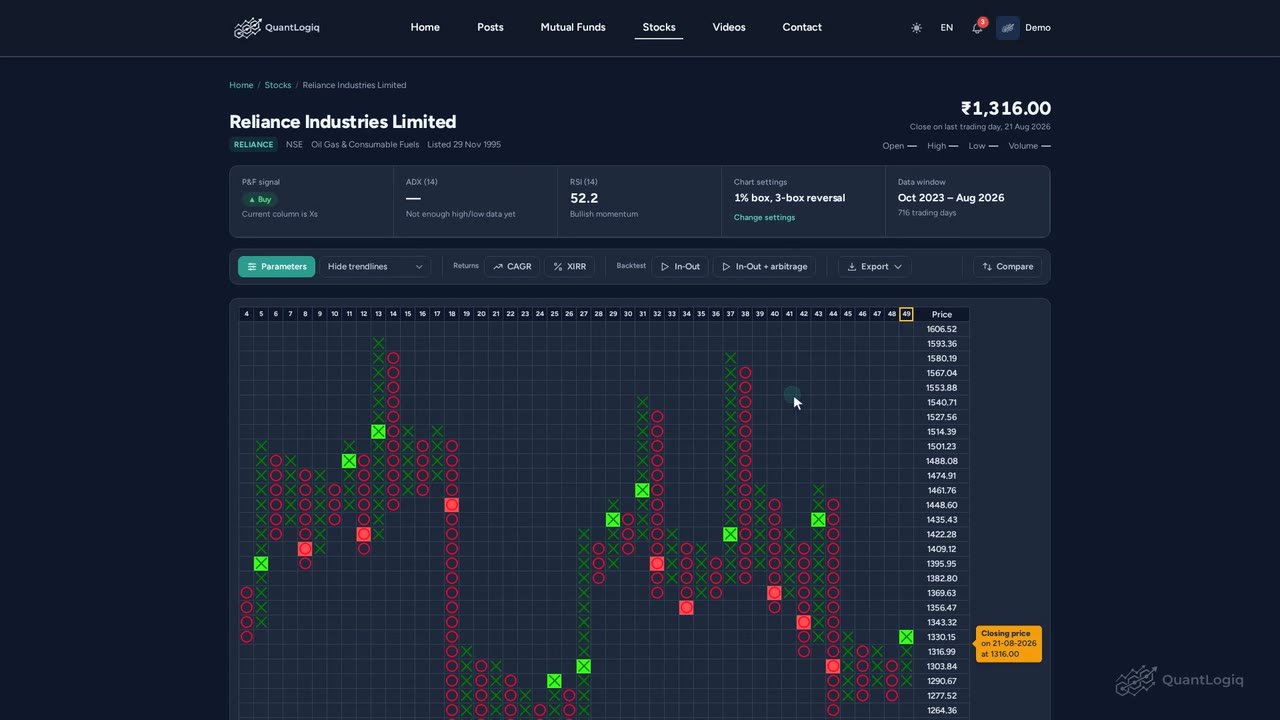
Trendlines and price targets on a P&F chart
QuantLogIQ can draw trendlines and price targets on any Point and Figure chart. Let's switch them on. Steps: 1. Use this dropdown, which sa...
 0:43
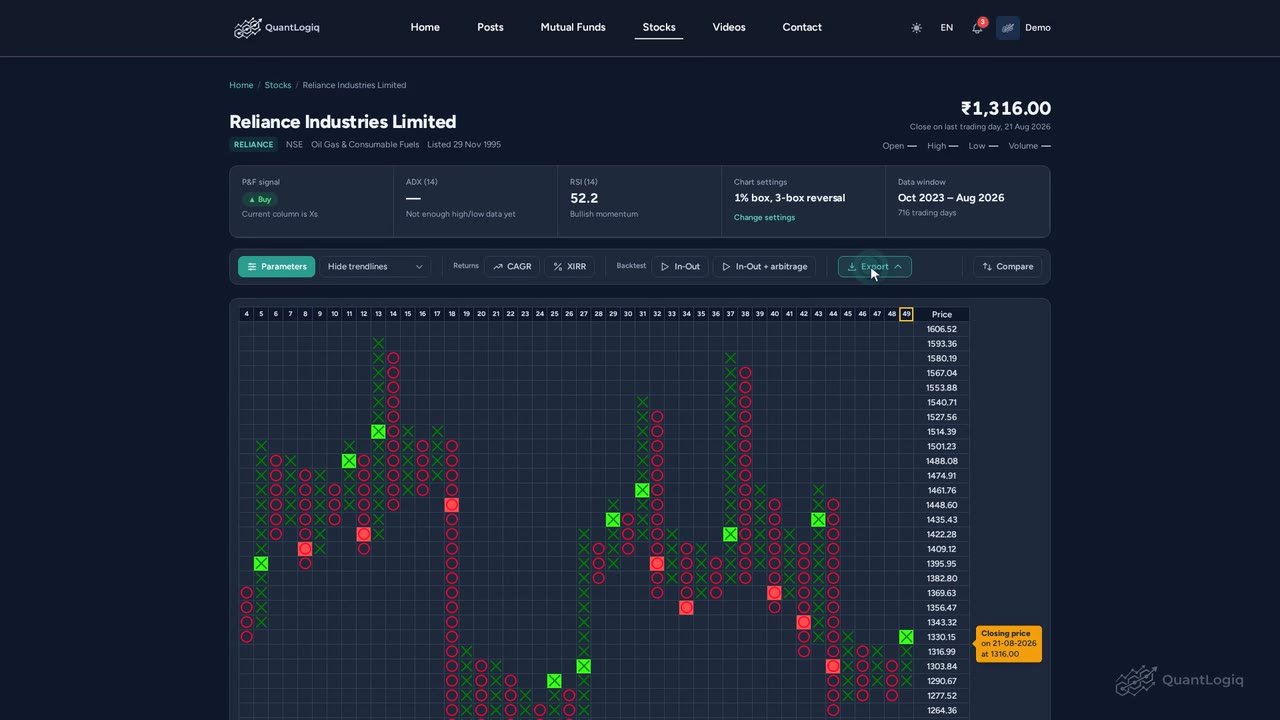
Price history and exporting a chart
Let's see how to check the recent prices of a stock, and how to save its chart. Steps: 1. Click Export, at the right of the toolbar. 2. Pri...
 1:00
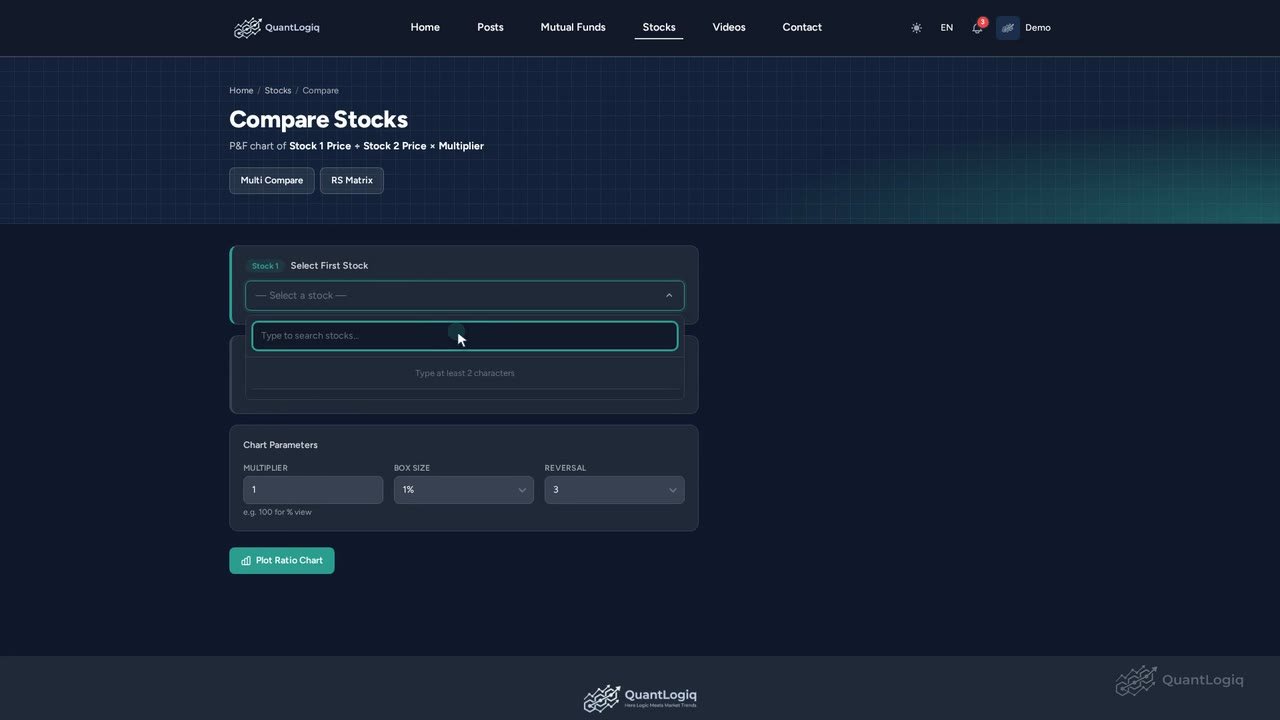
Compare two stocks with a ratio chart
Which of two stocks is doing better? The compare tool answers that with a single chart. Let's try Reliance against TCS. Steps: 1. Pick the...
 0:58
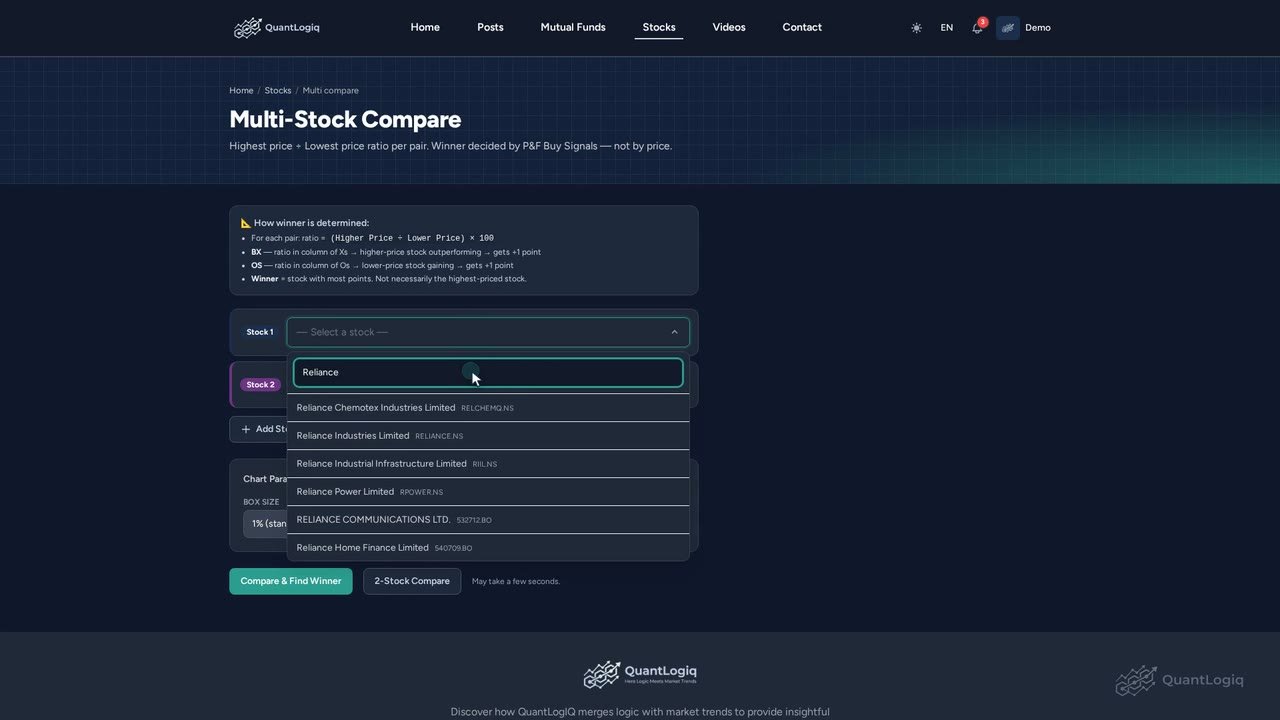
Compare many stocks and find the strongest
Want to compare more than two stocks at once? Multi-compare tests every pair, and tells you which one is strongest. Steps: 1. Pick the stoc...
 0:59
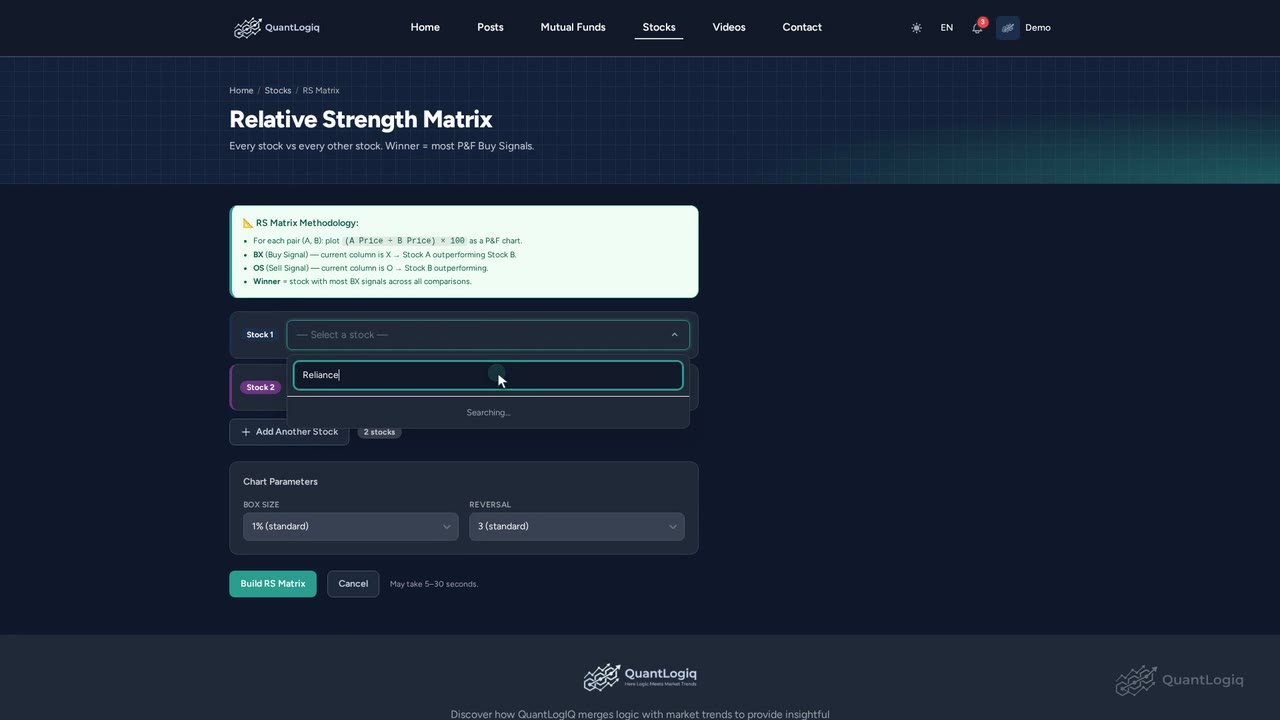
Build a Relative Strength Matrix for stocks
The RS Matrix, or relative strength matrix, ranks a group of stocks by how strong each one is against all the others. Steps: 1. Pick the st...
 0:49
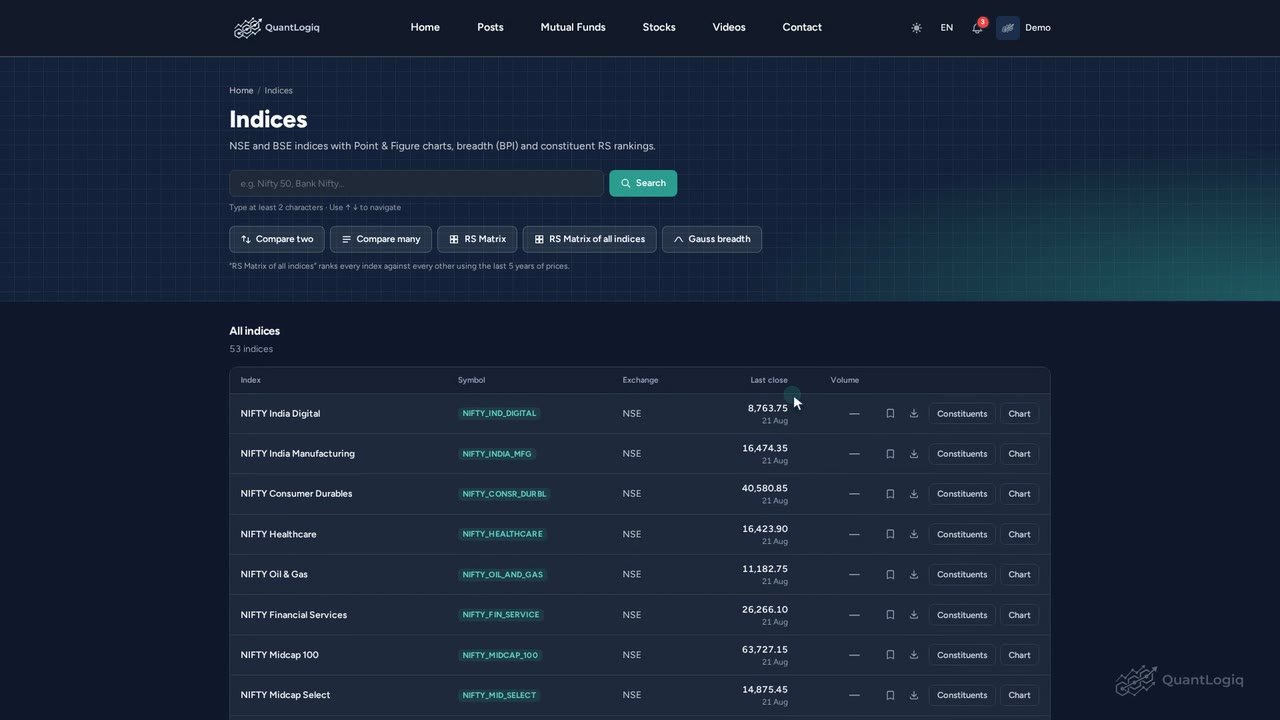
Browse market indices
QuantLogIQ covers the major Indian market indices too, like Nifty 50 and Bank Nifty. Let's take a look. Steps: 1. The Indices page lists ev...
 0:45
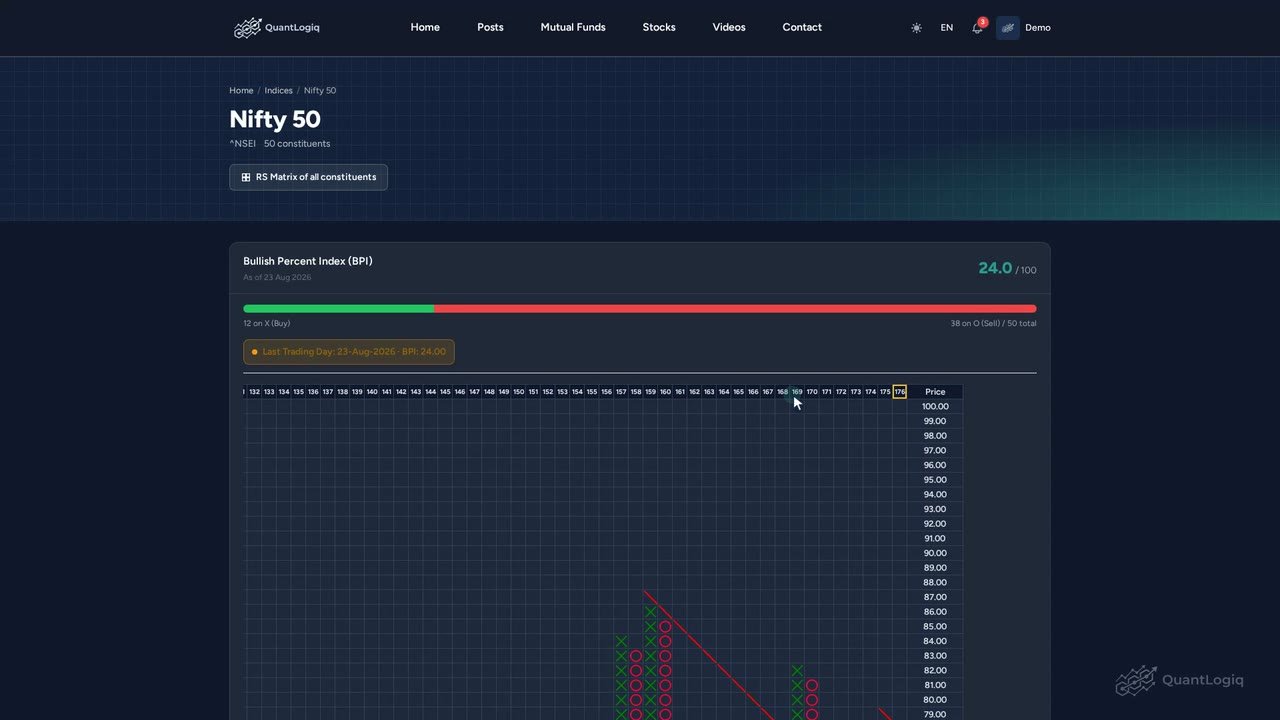
See the stocks inside an index
Ever wondered which stocks make up the Nifty 50, and how each one is doing? Let's look at the constituents page. Steps: 1. Scroll down to C...
 0:50
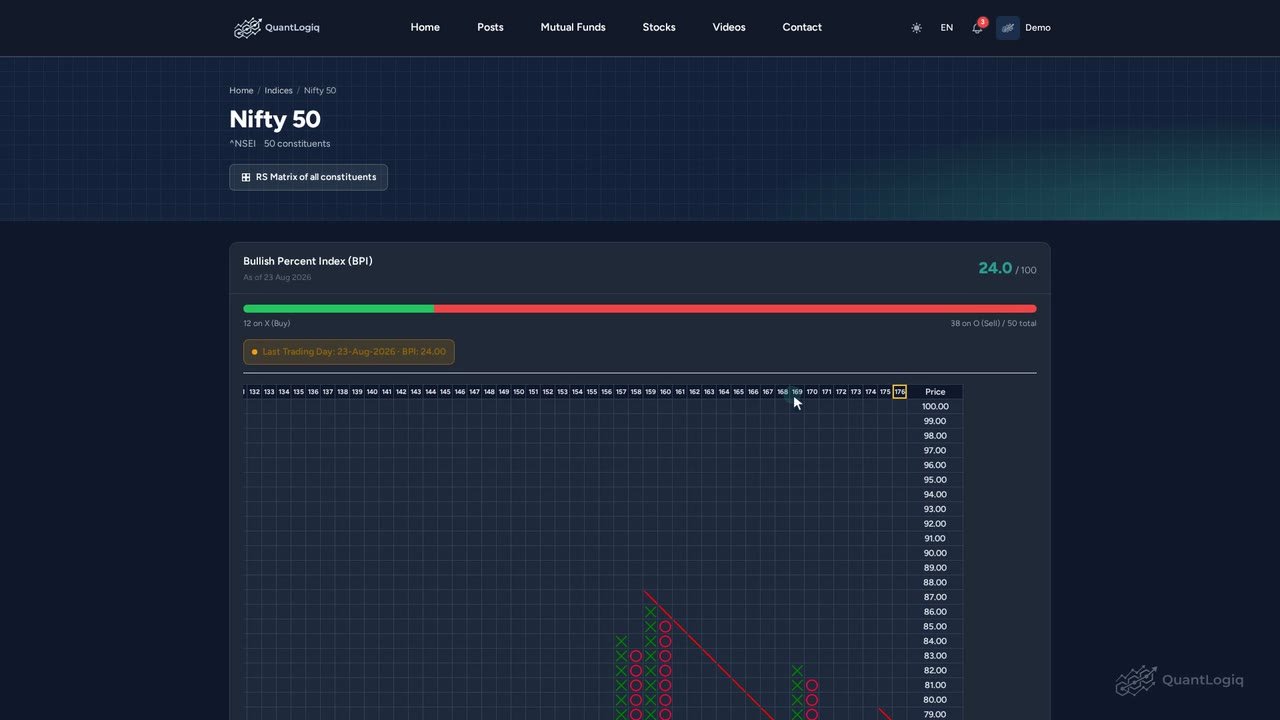
Market breadth with the Bullish Percent Index
Is the whole market strong, or just a few big stocks? The Bullish Percent Index, or BPI, helps you answer that. Steps: 1. BPI is the percen...
 0:41
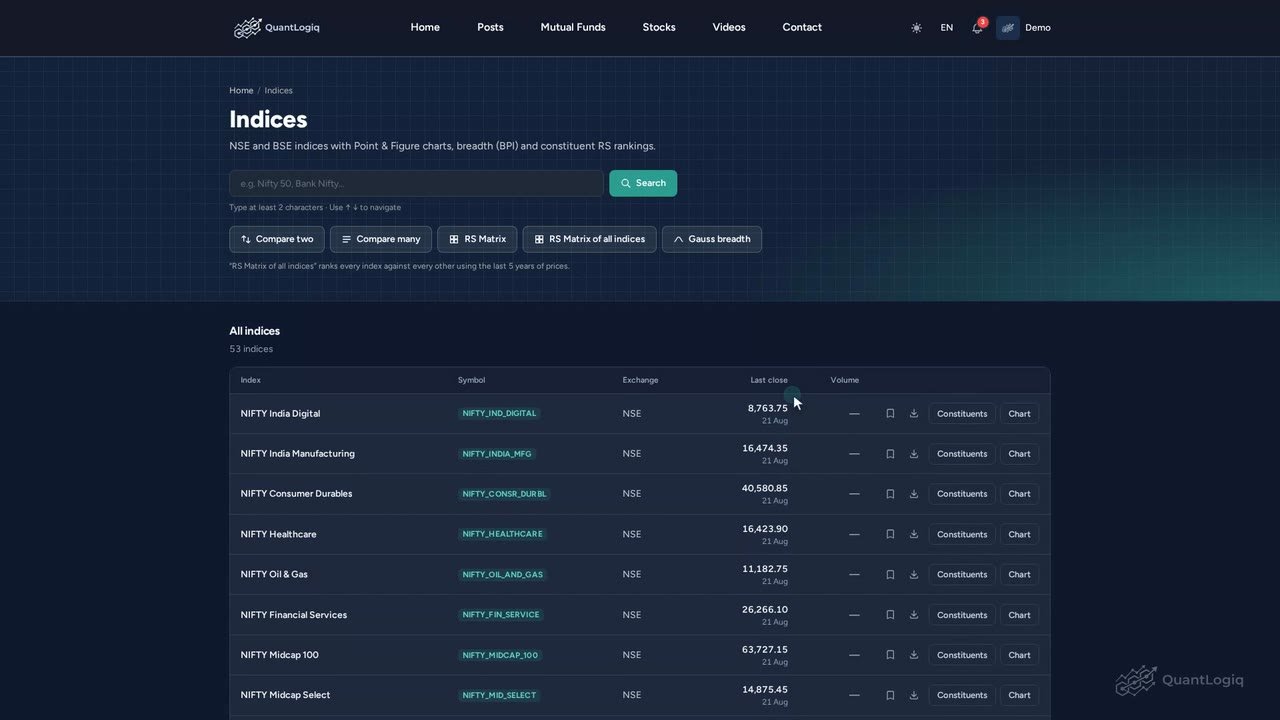
RS Matrix of all indices
Which parts of the market are leading right now? The RS Matrix of all indices ranks every index against every other. Steps: 1. From the Ind...
 0:37
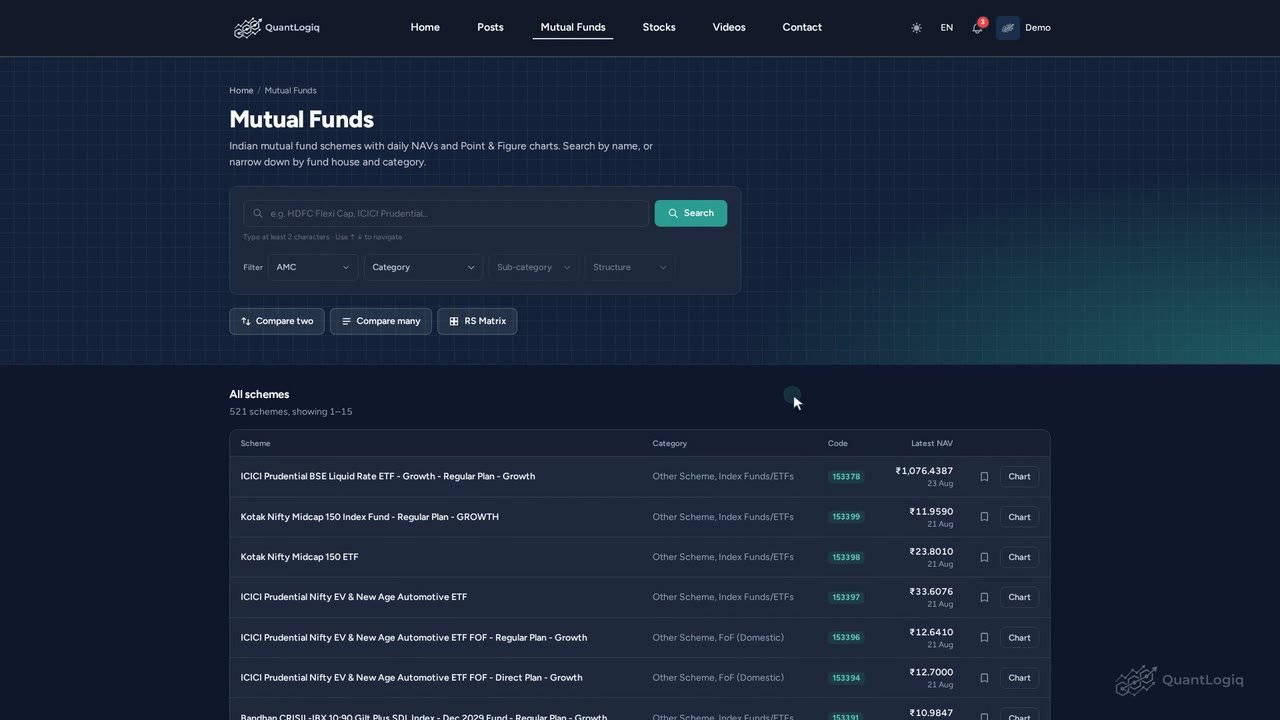
Find mutual funds with search and filters
There are thousands of mutual fund schemes in India. Let's see how to find the right one quickly. Steps: 1. Type a fund name or fund house...
 0:45
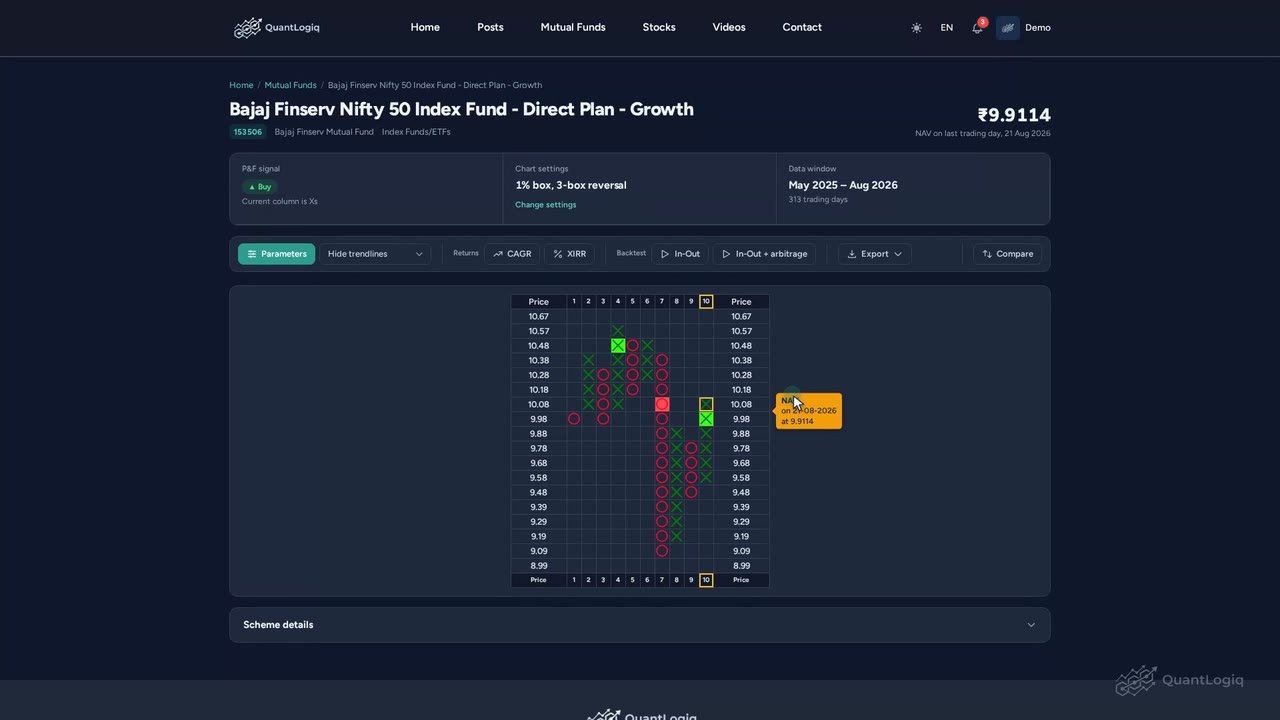
How to read a mutual fund's P&F chart
Every mutual fund on QuantLogIQ has a Point and Figure chart, built from its daily NAV. Let's read one. Steps: 1. At the top, you'll find t...
 0:53
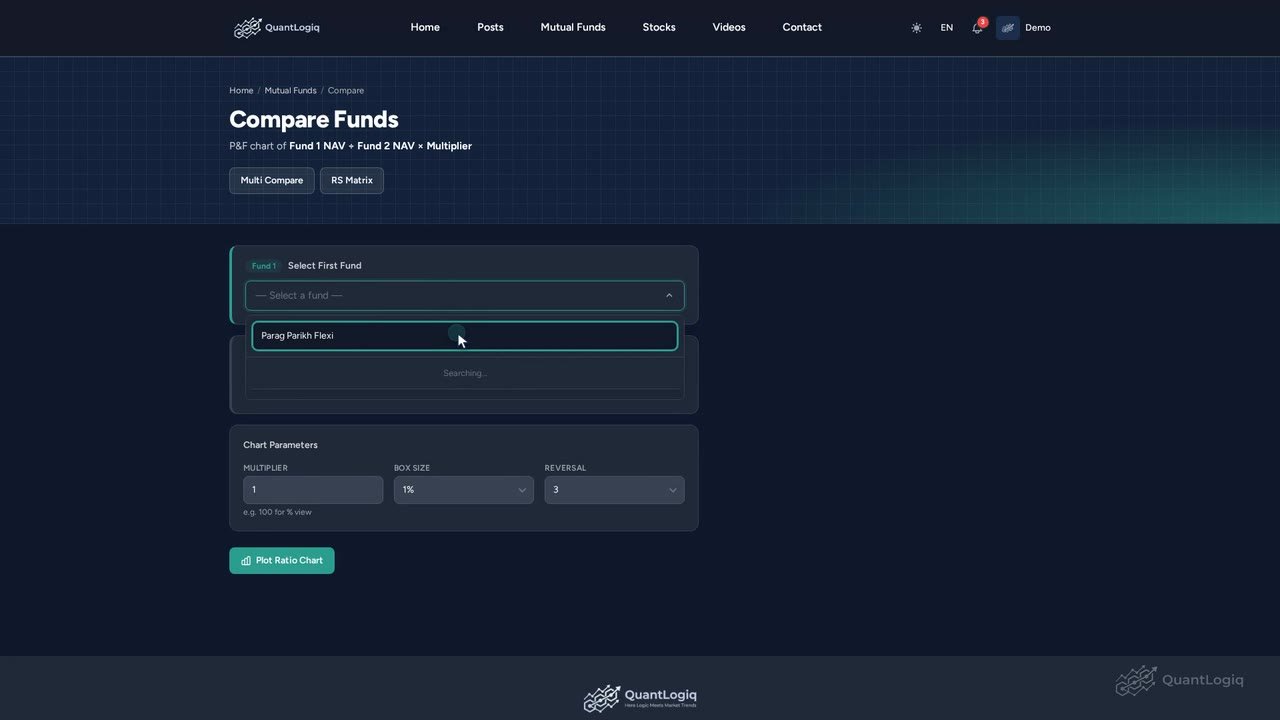
Compare two mutual funds with a ratio chart
Choosing between two mutual funds? Let's compare them with a single ratio chart. Steps: 1. Pick the first fund. Just type a few letters and...
 0:56
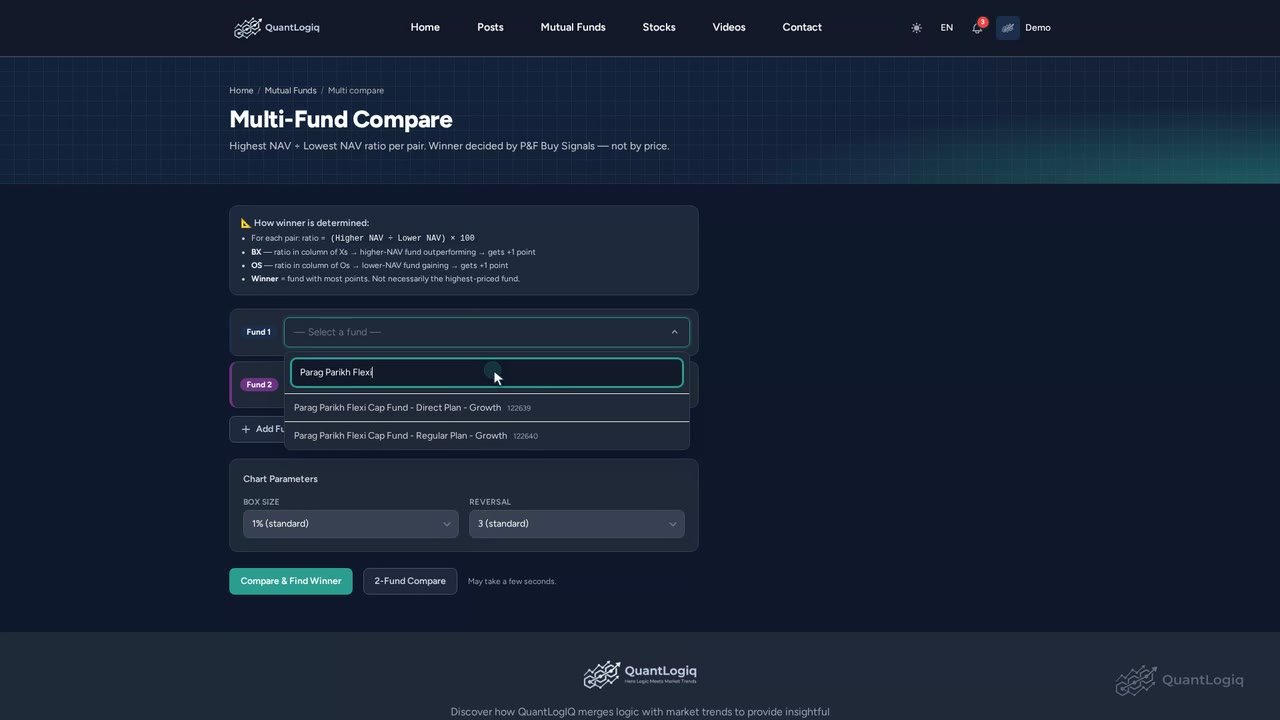
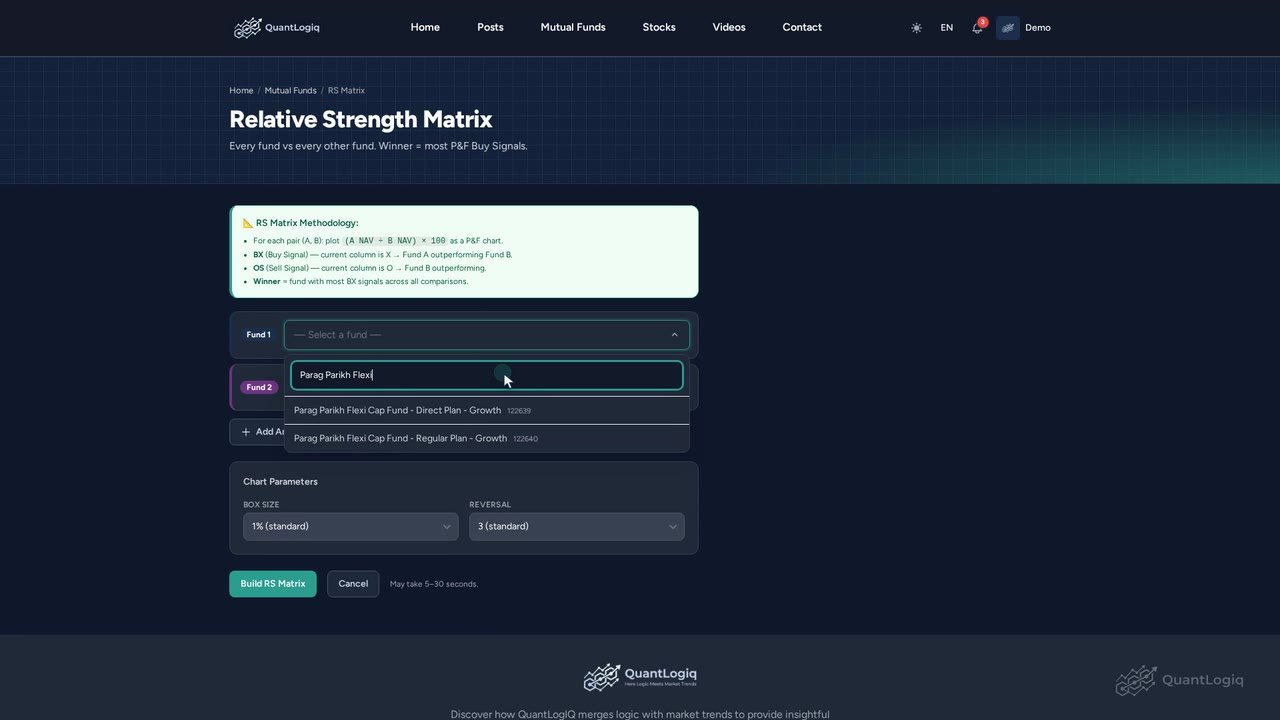
Compare many mutual funds and find the strongest
Comparing several funds? Multi-compare tests every pair, and finds the strongest one. Steps: 1. Pick the funds you want to compare. Click A...
 0:56
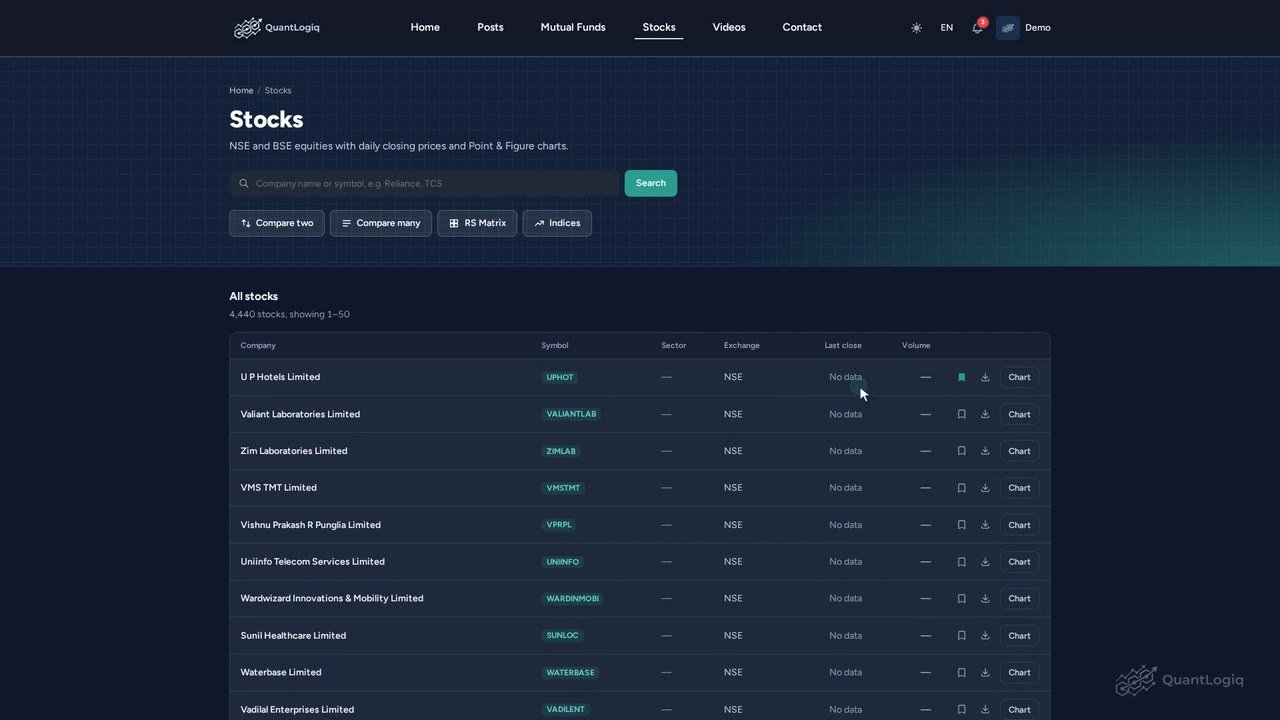
Build a Relative Strength Matrix for mutual funds
The RS Matrix ranks a group of mutual funds by how strong each one is against all the others. Steps: 1. Pick the funds you want to compare....
 0:44
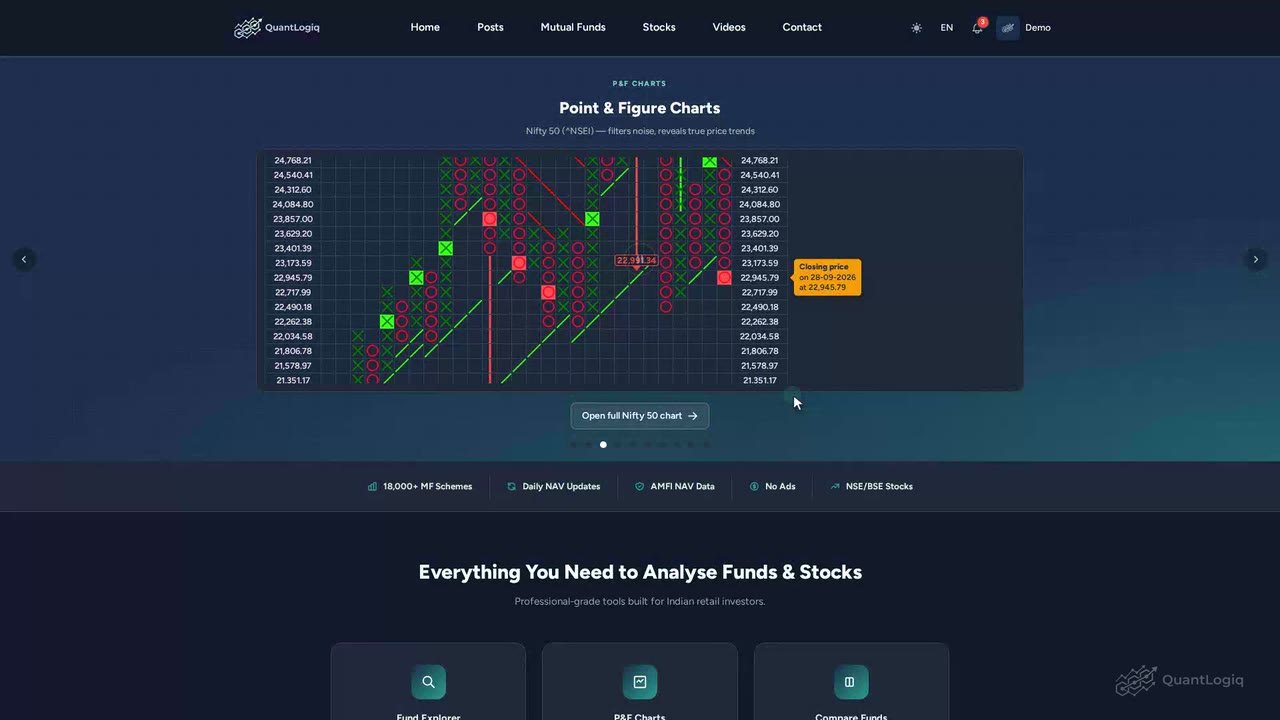
Use your watchlist
Your watchlist keeps the funds and stocks you care about in one place, and it's what your alerts are based on. Steps: 1. To add a stock, ju...
 0:48
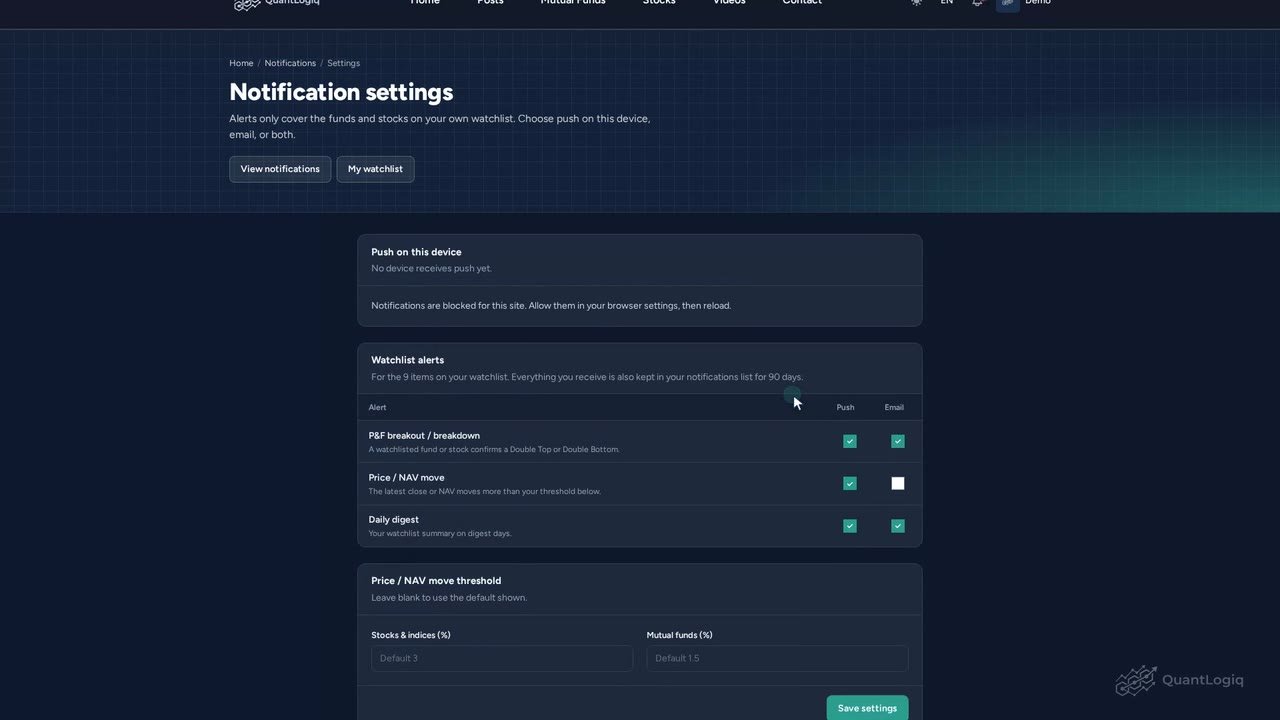
Your notifications inbox
QuantLogIQ watches your funds and stocks for you, and tells you when something important happens. Let's see where those alerts appear. Step...
 0:43
Choose which alerts you get
You decide which alerts QuantLogIQ sends you, and how. Let's look at notification settings. Steps: 1. For each alert type, breakouts, price...
 0:34
Research and guides
Besides the tools, QuantLogIQ has short research articles and guides, to help you understand what the charts are telling you. Steps: 1. The...
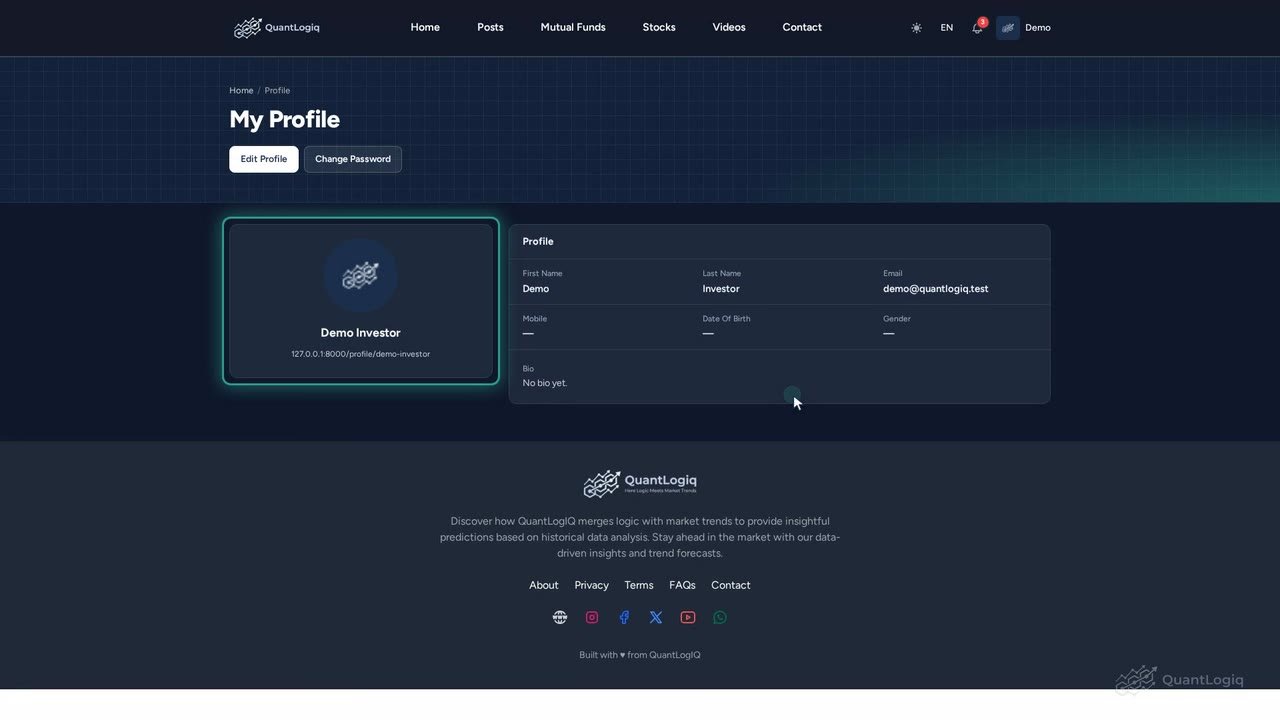 0:41
Update your profile and password
Let's see how to update your profile, and change your password. Steps: 1. This is your profile page. 2. Click Edit Profile to change your n...